
Analyzer
This screen shows a previous or live recording.
Long-press a graph to show/hide any of those graphs (cpu, memory, network or b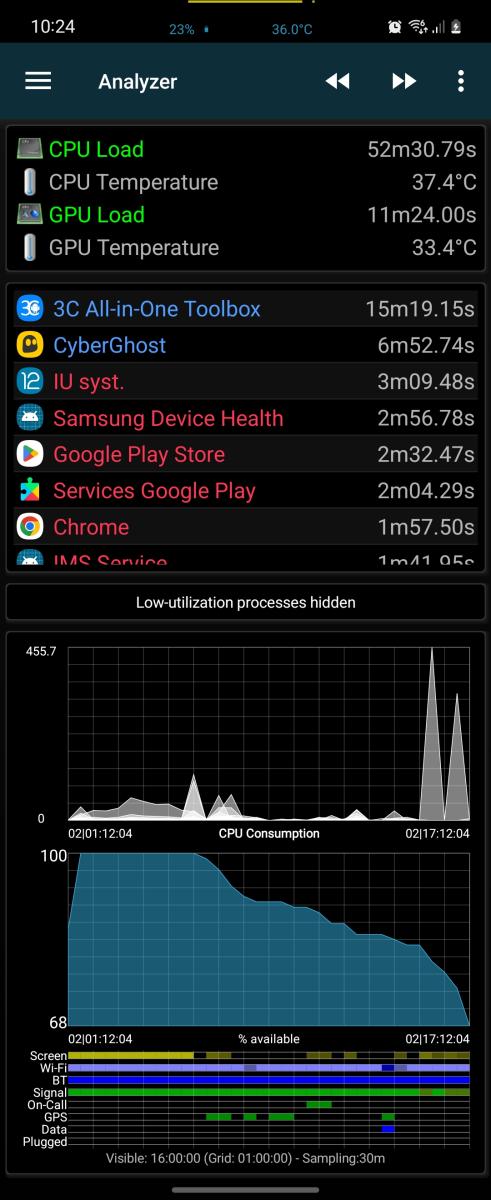 attery) or crop current recording to visible content (updating totals) or change zoom factor.
Tap the battery graph to change the data shown (%, mA, %/h, mV, temperature).
Tap the frequency entry at the top to show the frequency curves instead of CPU consumption.
Tap the temperature entry at the top to show the temperature curve instead.
Long-press an item in the top lists to obtain more options:
- Hide the item
- Show network use (if recorded)
- Show times as percent or raw
Use the actions/overflow menu in title bar to:
- Open previous or next (in time) recording
- Reload the current recording (in case you zoomed and cropped it).
- Delete the current recording (confirmation is needed by default).
- Open the recording selection screen
- Add/edit comment on current recording (will be visible in selection screen).
WARNING:
- Note that frequency, temperature, battery, network and component states are not recorded by default. This needs to be enabled in the app settings.
- The more information is recorded the more the app will consume.
- Default memory consumption recording is based on RSS memory instead of real memory consumption to improve recording efficiency. It is possible to change to real memory consumption in the recorder settings.